Task graph fingerprints and performance prediction
Task graph fingerprints and performance prediction
Computer simulations and HPC are essential for progress in the sciences. It is important to engineer applications such that they fit precisely to the scientific challenge at hand. Yet the way we write HPC code — notably how we parallelise it — is often surprisingly ad hoc. Developers add tasks and parallel fors in a trial-and-error fashion, measure the results, and then either roll back or continue tweaking other parts of the code. Introducing parallelism is not done systematically: there is rarely a clear hypothesis of what the gains will be, no validation that the delivered solution meets the objective, and no systematic exploration of alternative approaches.
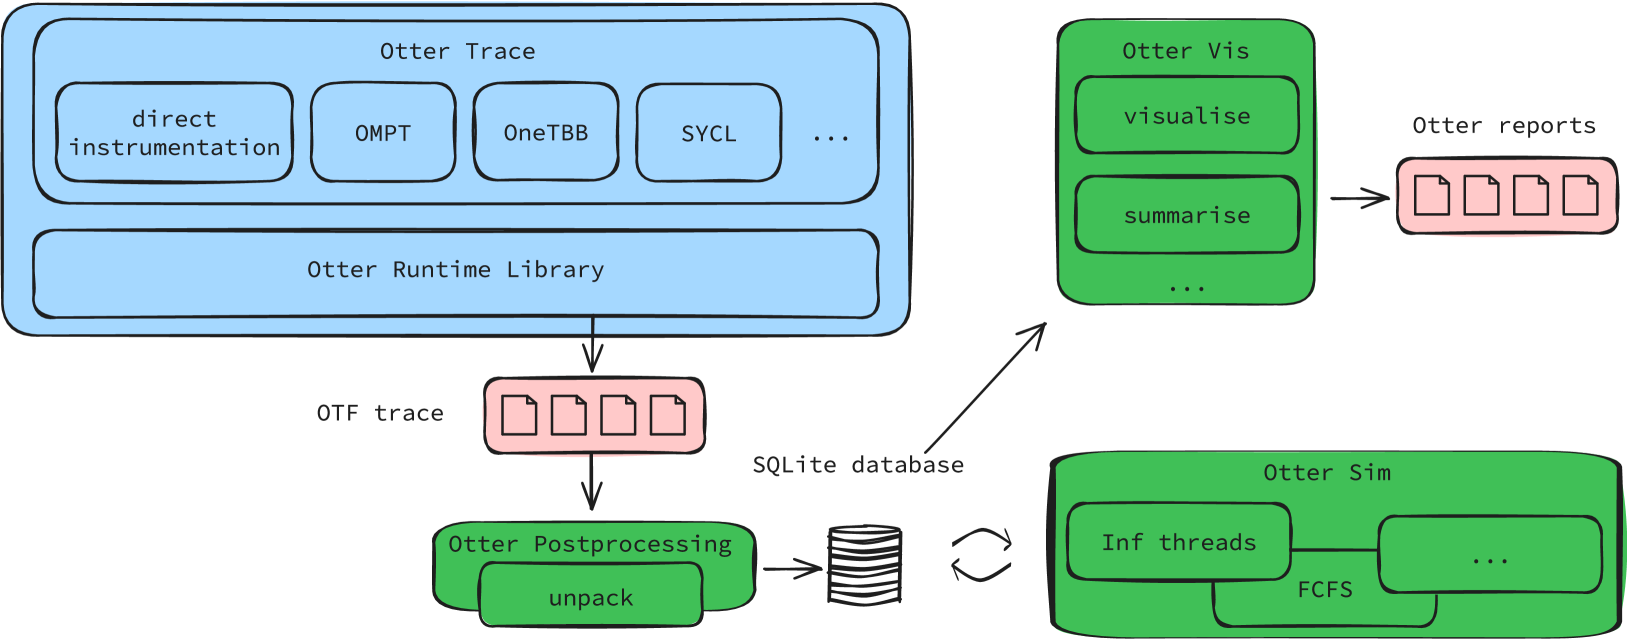
We propose a pragma language in which developers annotate regions of code where they believe parallelism could be introduced (i.e. where a task or parallel region might exist). The code is then run once, and the pragmas yield an application fingerprint. A simulator takes this fingerprint and compiles a recipe detailing which tasks and parallel regions are likely to yield performance gains, how much the predicted gain is, and other relevant metrics. Using this recipe, parallelism can be introduced systematically; furthermore, we can also identify flaws in implementations that do not match the predicted performance.
Preparatory work
We have already a prototype of a tracing code which is available from https://github.com/Otter-Taskification/otter/wiki. There are visualisation scripts available for the (potential) task graphs, and the tool comes along with a C++ pragma API and OMPT bindings.
Examples of issues that we can find with such a tool have been published at https://dl.acm.org/doi/10.1007/978-3-030-85262-7_8. Another one is https://arxiv.org/html/2406.03077v3. In the papers, we naively apply some parallelisation techniques and then show that they yield poor performance even though they logically seem to be a very good idea. With a tool that can predict (simulate) the performance gains, we can either not apply the transformation (and hence avoid a dead end) as a programmer, or we can discuss in a data-driven way why OpenMP’s runtime (or any runtime really) should perform in a certain way.
Workplan
- Familiarise with code and streamline where appropriate.
- Write a few first variants of a simulator (e.g. with greedy task scheduling mirroring OpenMP).
- Develop techniques to embed the simulator into the tracing (in-situ simulation) such that we avoid writing excessive trace files.
- Study how simulations can guide state-of-the-art schedulers, e.g. through task priorities, to deliver faster task execution.